Newest salaries in Data Science and AI explained by SHAP values
The 2022–2023 year gross salaries: SHAP values for experience level, job title, and more

Following the analysis of my previous article, here I use the newest updated public dataset taken from the ai-jobs.net website that contains about 2,800 2020–2023 year gross salaries of Data domain professionals, including Data Scientists, Data Engineers, Data Analysts, Data Managers, and many more. The dataset is also publicly available on Kaggle. Full details of the analysis can be found in this public Kaggle notebook.
Step 1 — data preprocessing
Here, data preprocessing consists of the following steps:
converting the label (yearly gross salaries) to kUSD/year;
selecting only the latest salaries (from 2022 and 2023 years);
excluding 1% of the highest and 1% of the smallest salaries as potential outliers;
encoding rare categorical variables (in employee_residence, job_title, and experience_level columns) with no more than 30 different categories in each column and at least 20 data samples in each category;
finally, dropping unused columns.
Step 2 — setting a Machine Learning model to predict the yearly gross salaries
The data prepared with the previous step are randomly split between training and test samples and modelled with the CatBoostRegressor model that explicitly takes into account categorical features. The root mean squared error (RMSE) of the resulting model is about 47.3 kUSD/year, a significant improvement compared to the baseline model RMSE of about 61.1 kUSD/year (assuming the same salary of about 137.6 kUSD/year for every record).
Step 3 — explanation of the obtained Machine Learning model.
Here, we are using the SHapley Additive exPlanations (SHAP) method, one of the most common to explore the explainability of Machine Learning models. The units of SHAP value are hence in kUSD/year.
First, we look into the span of SHAP values for every feature of our interest:
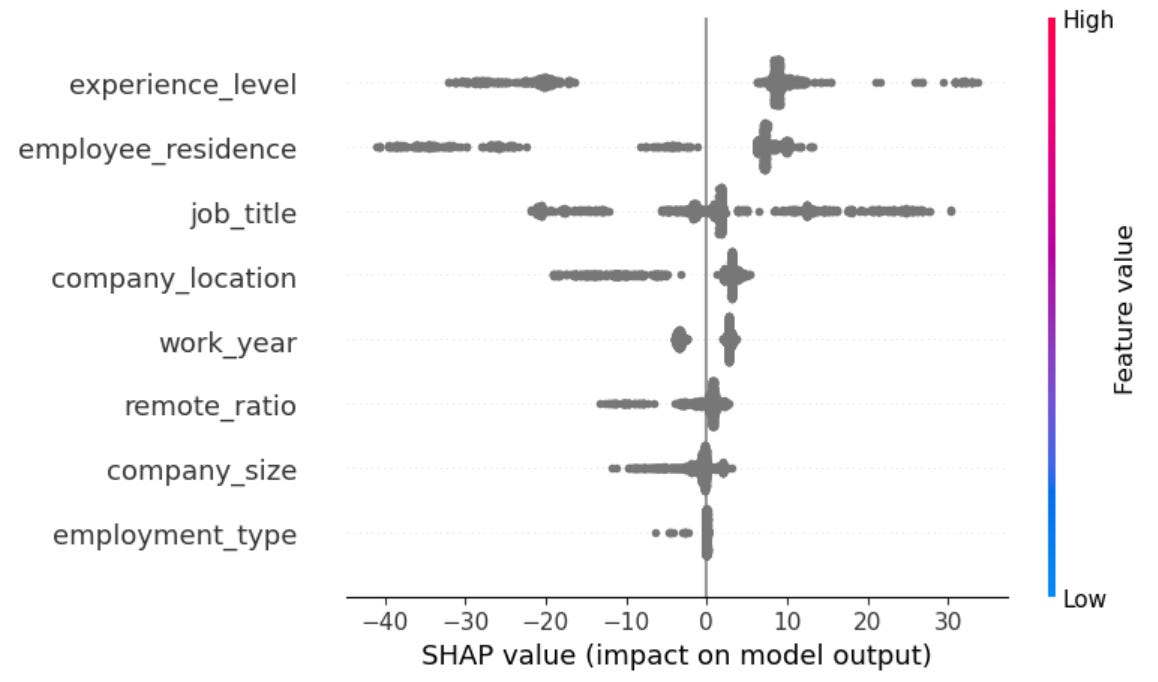
Here, the most essential features that determine the salary of Data professionals are the experience level, employee residence, and job title.
Now, look for more details for every feature.
For the work year, not surprisingly, we see that the highest gross salaries are associated with the 2023 year:
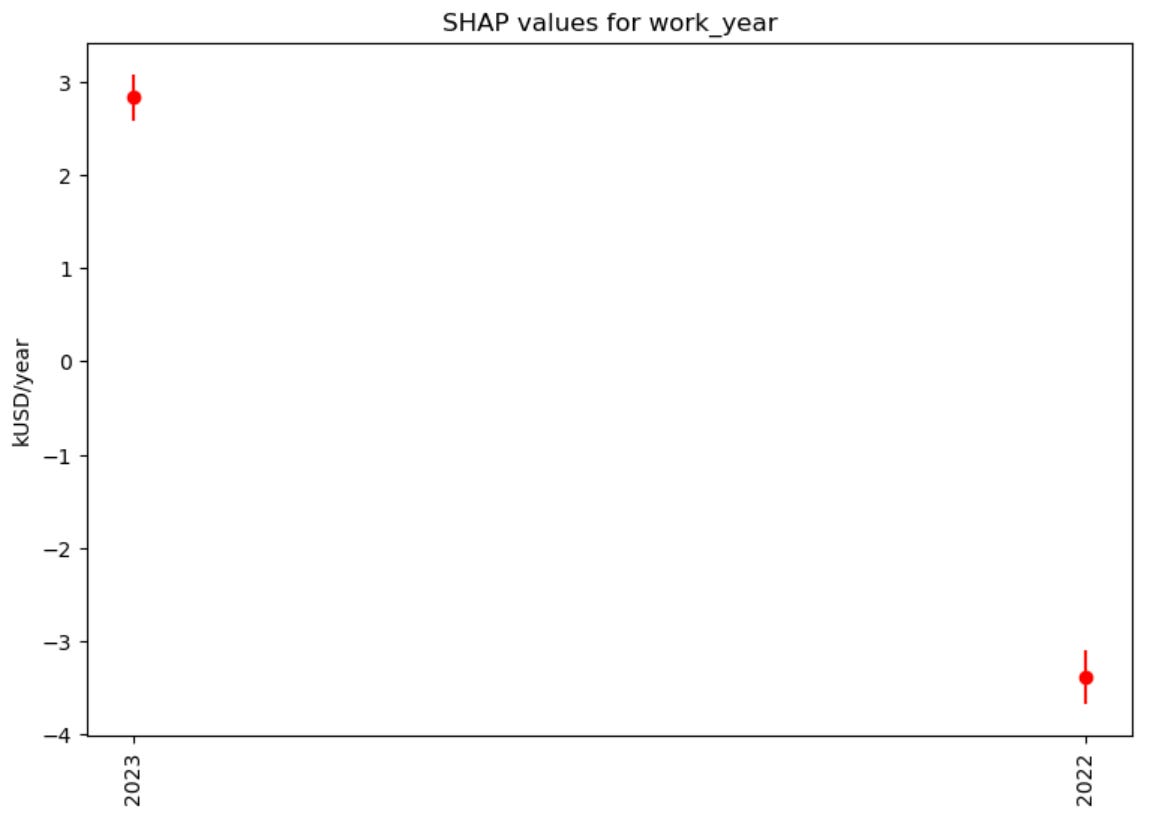
In other words, assuming other variables to be the same, the average gross salary (worldwide) increased between 2022 and 2023 by about 6.2 kUSD/year, or by about 4.5%.
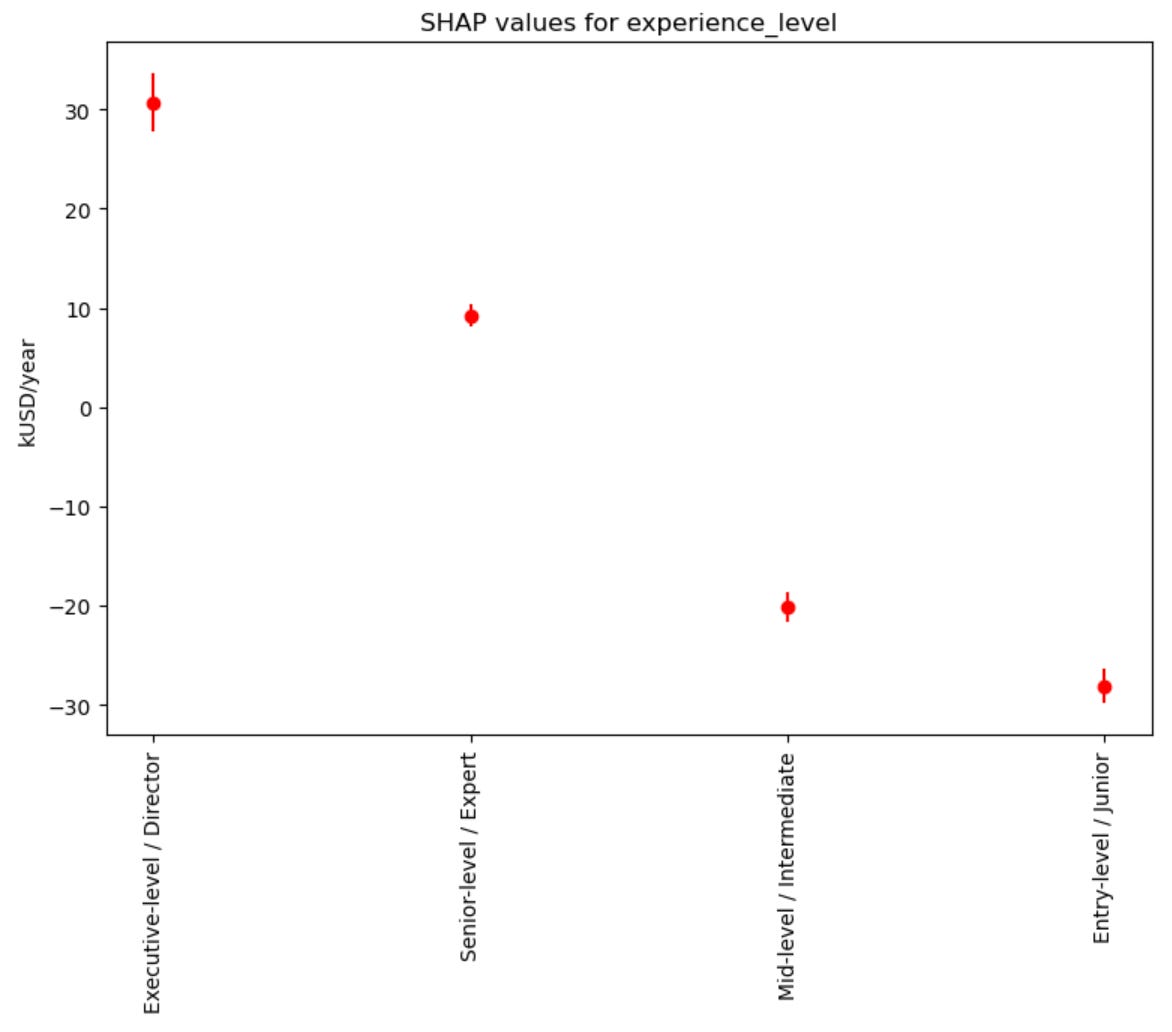
Regarding experience levels, not surprisingly, the highest gross salaries are associated with Executive-level or Director roles:
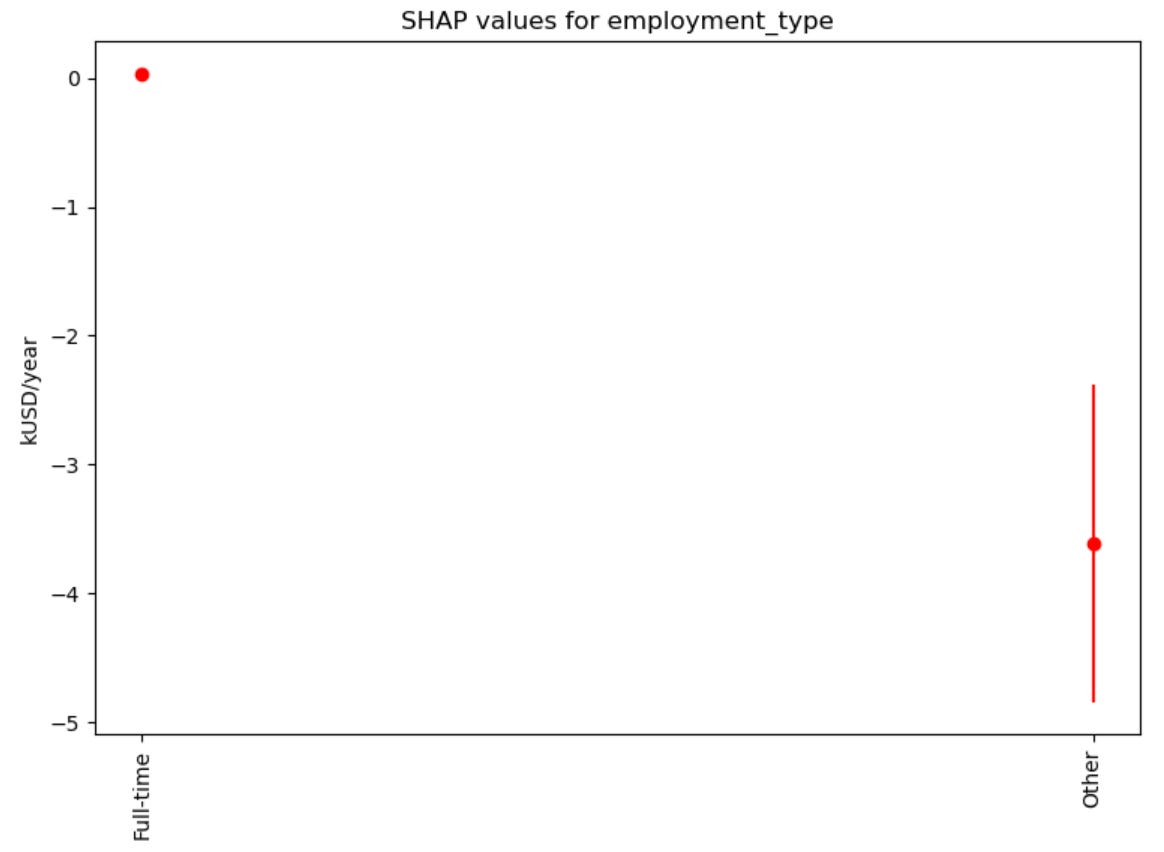
About employment types, the highest gross salaries are associated with full-time employment:
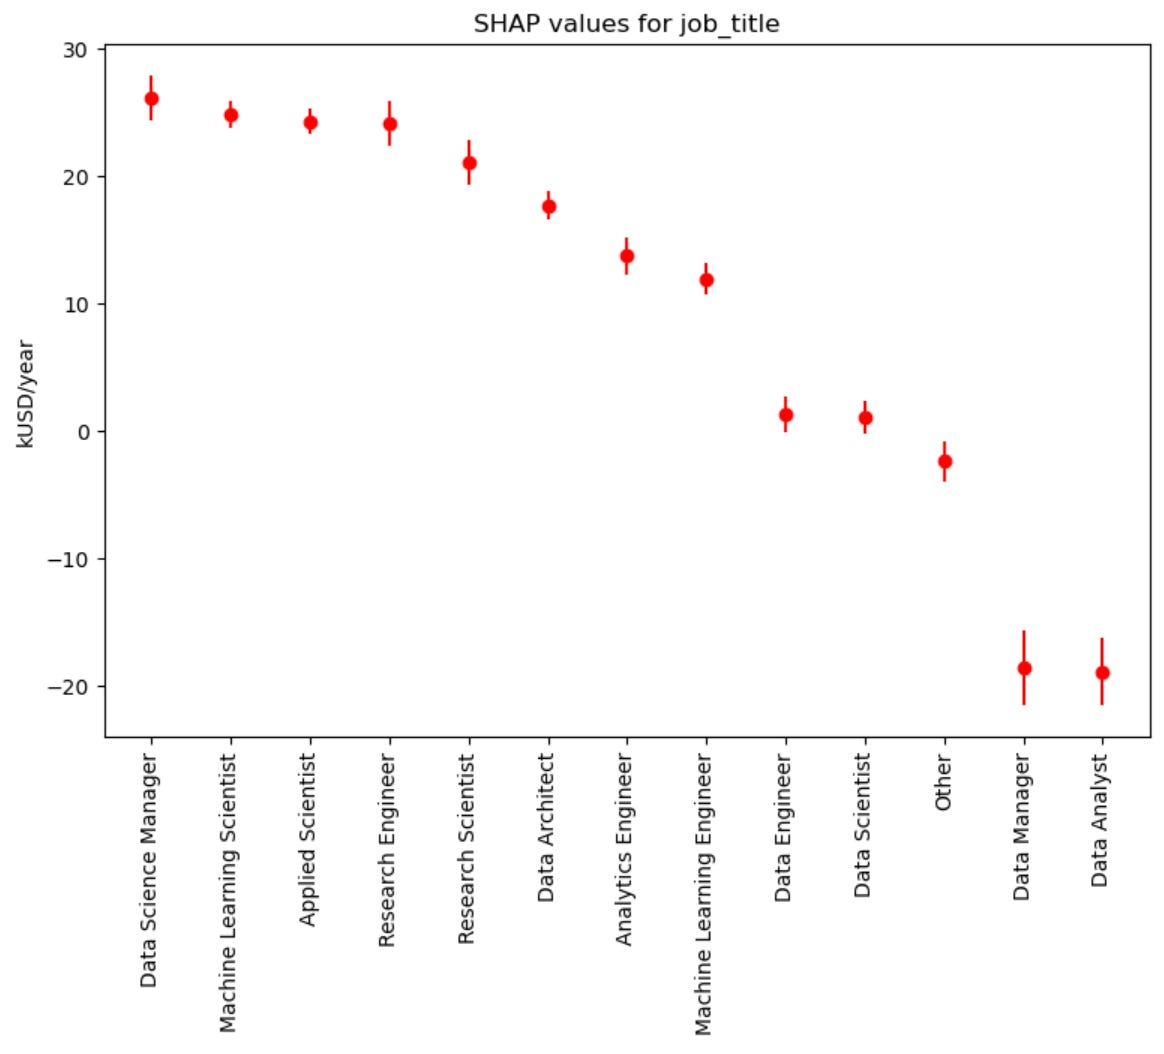
About job titles, remarkably, the highest gross salaries are associated with Data Science Managers, followed by Machine Learning Scientists, Applied Scientists, Research Engineers, Research Scientists, and Data Architects:
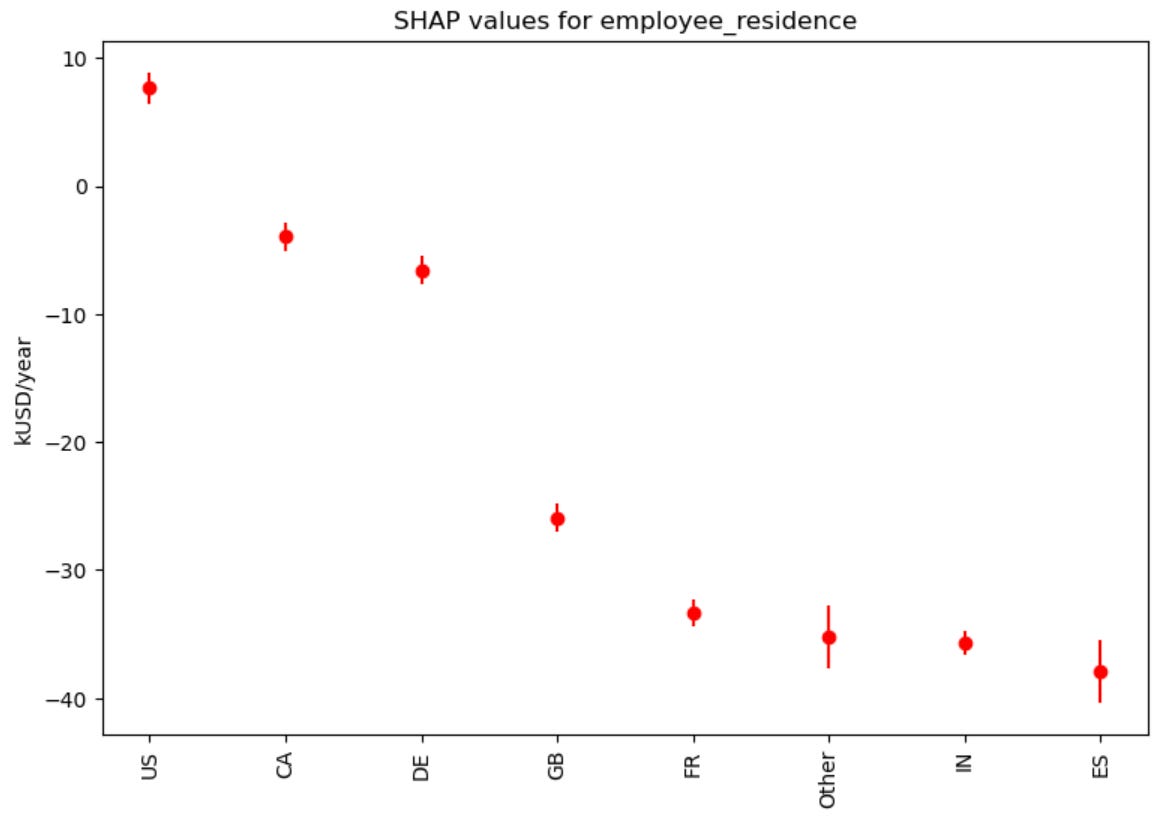
Regarding employee residence countries, we see that the highest gross salaries are associated with the United States, followed by Canada and Germany:
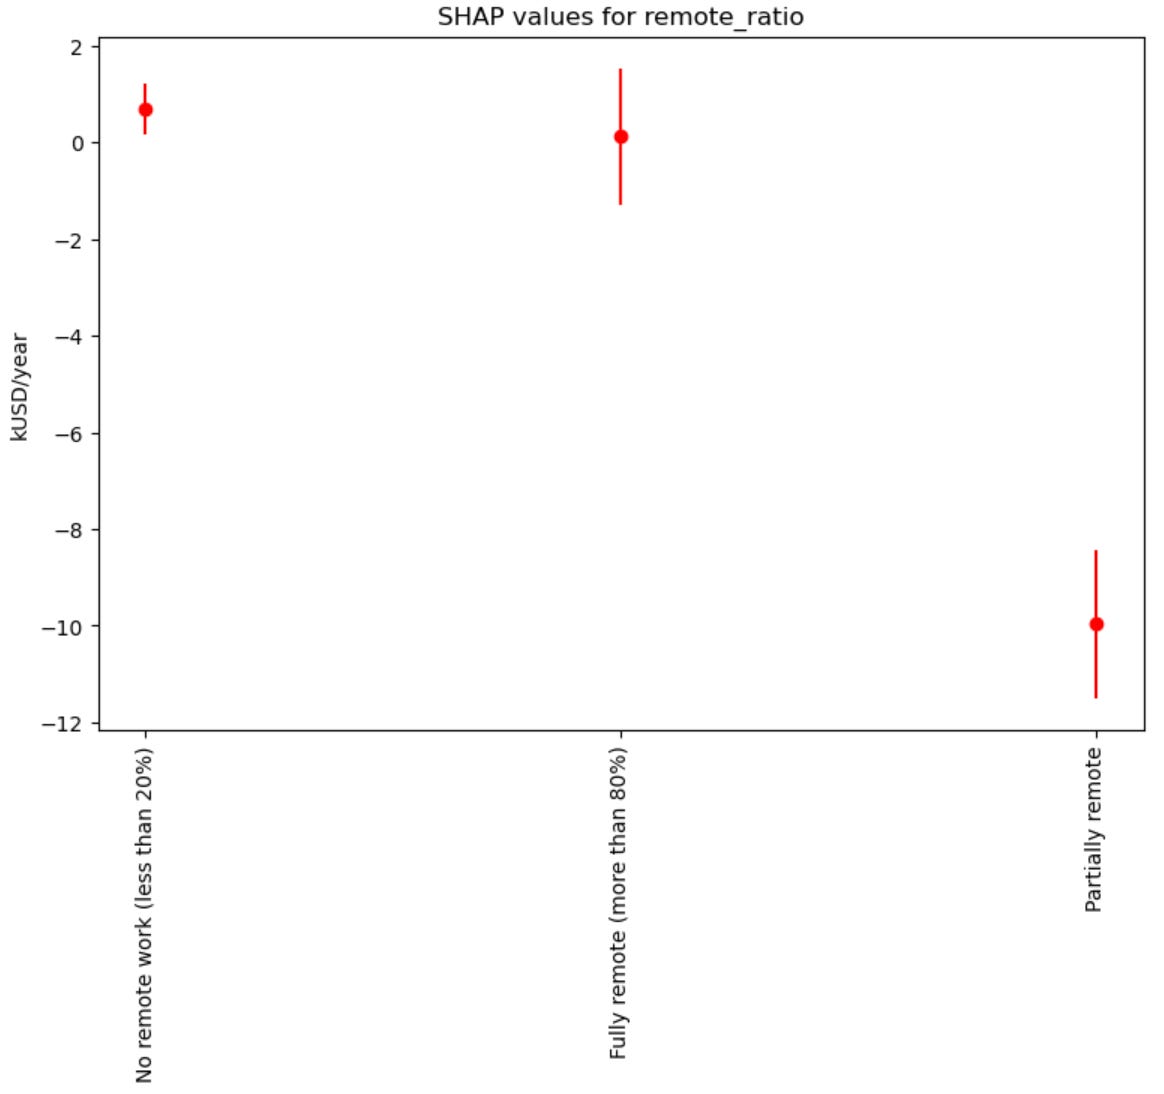
About the remote work ratio, remarkably, the highest gross salaries are associated with either no remote or fully remote jobs:
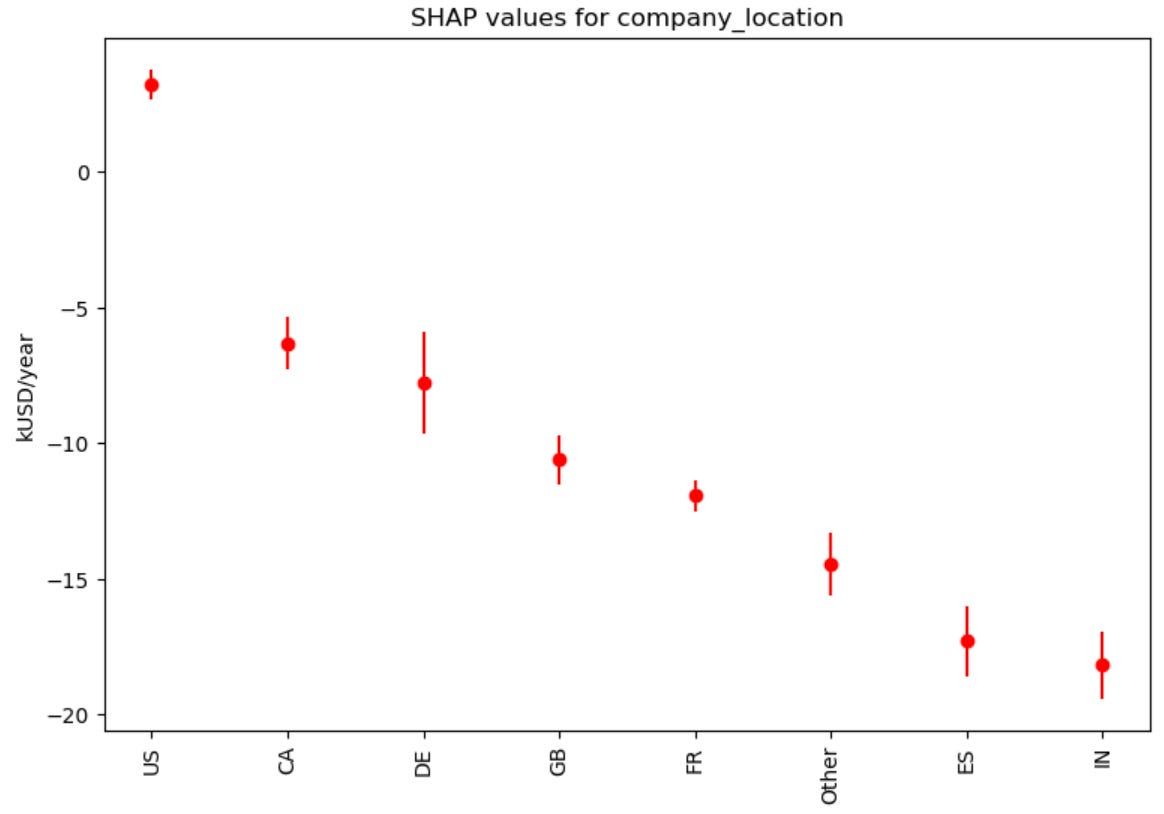
Regarding company location countries, we see that the highest gross salaries are also associated with the United States, followed by Canada and Germany:
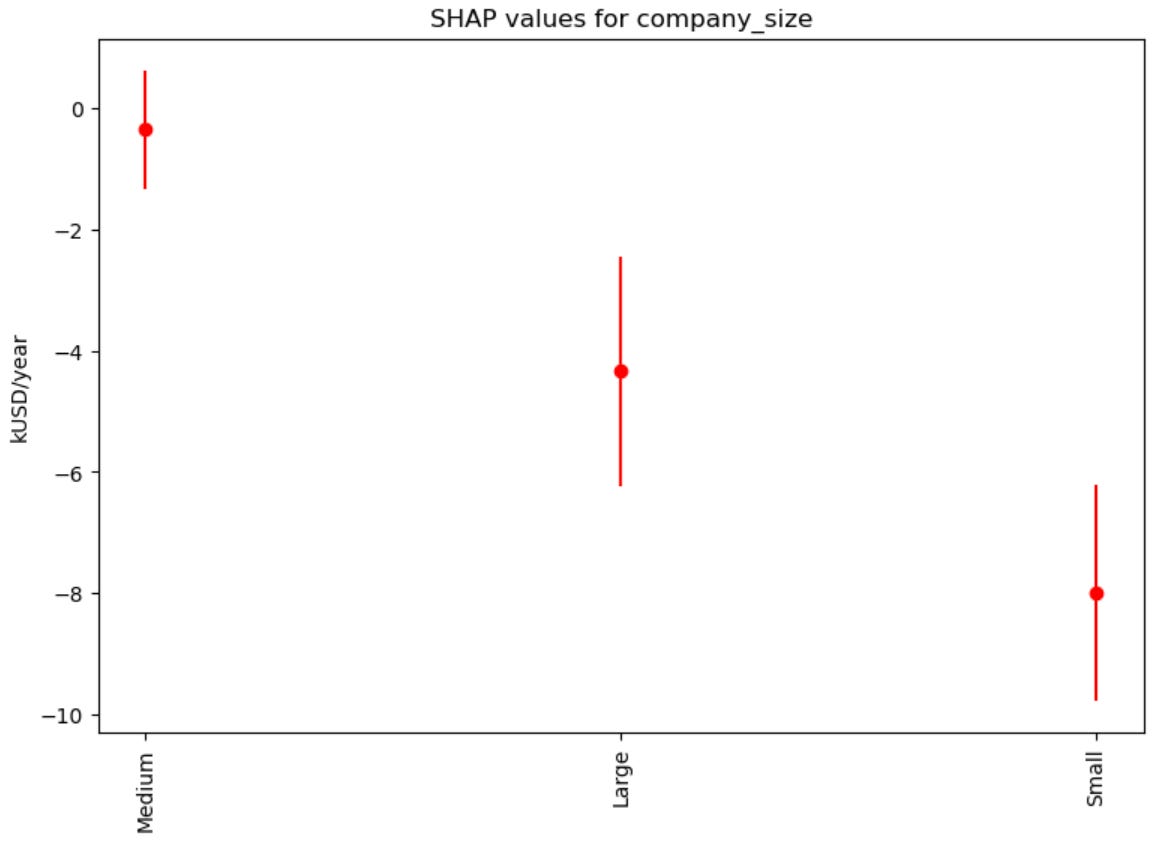
Finally, about company sizes, we see that the highest gross salaries are associated with medium-sized companies (50 to 250 employees):
As a final note, the title for this article has been manually adjusted using my publicly available Machine Learning model, see this for more details.
I hope these results can be useful for you. In case of questions/comments, do not hesitate to write in the comments below or reach me directly through LinkedIn or Twitter.

