
In which country the PhD degree is the most valuable add-on for a Data Scientist position?
As a follow-up to the previous story How much adds a PhD to a Data Scientist’s salary — explanation from the Stack overflow 2017–2020…

As a follow-up to the previous story How much adds a PhD to a Data Scientist’s salary — explanation from the Stack overflow 2017–2020 survey data | by Dmytro Iakubovskyi | Jul, 2022 | Medium, here we look at the PhD-added value to yearly compensation of a Data Scientist position. The previous analysis is based on the United States only, and here we expand the analysis into all countries represented in this survey.

Step 1 — data preprocessing
Here, data preprocessing consists of the following steps:
selecting countries with at least 50 responds from Data Scientist positions;
rescaling the label column to kUSD/year;
removing 5% (5%) responders with the largest (smallest) compensations;
selecting only the high cardinality data in categorical features;
replacing null values.
Step 2 — setting a Machine Learning model to predict the yearly compensation
The data prepared with the previous step are randomly split between training and test samples, and modelled with the CatBoostRegressor model that explicitly takes into account categorical features. The root mean squared error (RMSE) of the resulting model is about 28 kUSD/year, an improvement compared to the baseline model RMSE of about 40 kUSD/year (assuming the same yearly compensation of about 68 kUSD/year for every responder).
Step 3 — explanation of the obtained Machine Learning model.
Here, we are using SHapley Additive exPlanations (SHAP) method, one of the most common to explore the explainability of Machine Learning models. The units of SHAP value are hence in kUSD/year.
First, we look into the span of SHAP values for every feature of our interest:
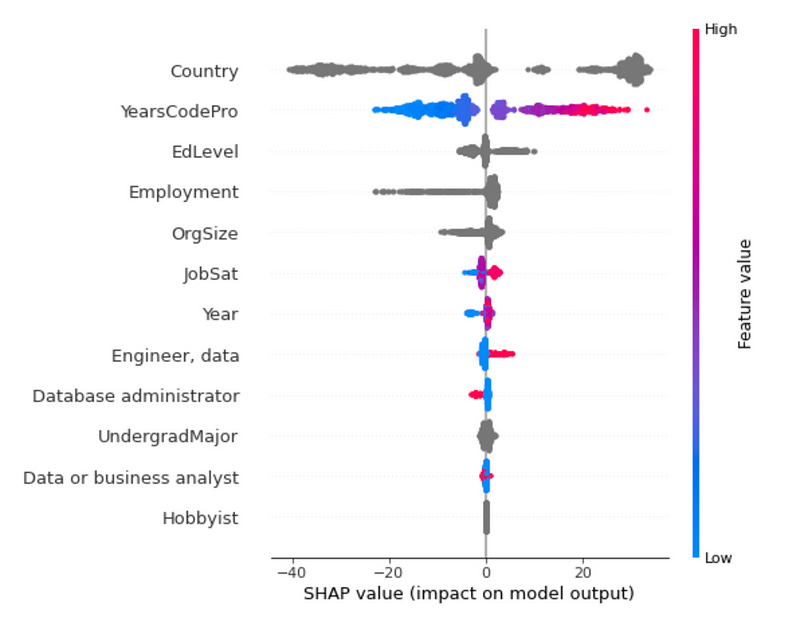
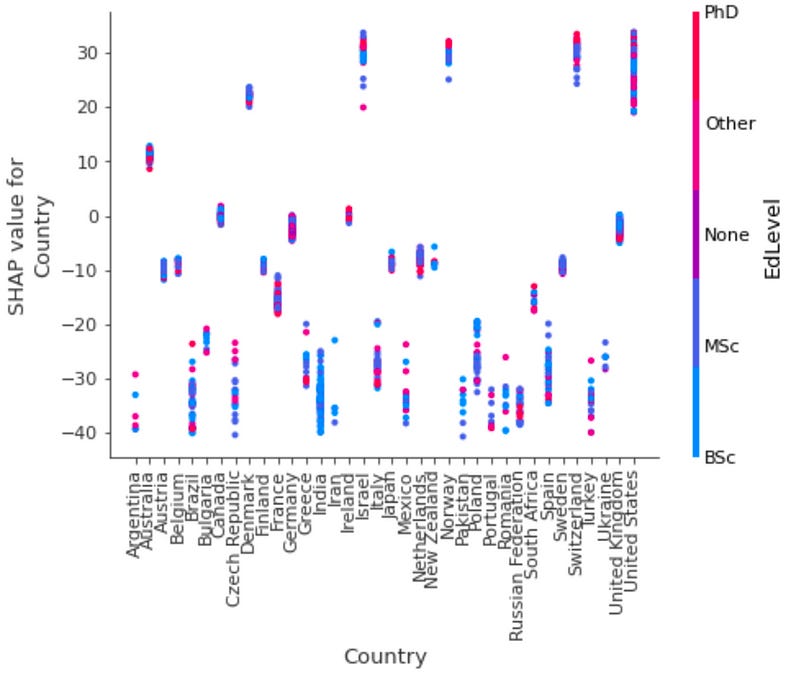
Not surprisingly, the country in which the Data Scientist position is located is the most important distinguishing factor for yearly compensation. The countries with the largest SHAP values are the United States, Switzerland, Norway, Israel, and Denmark:
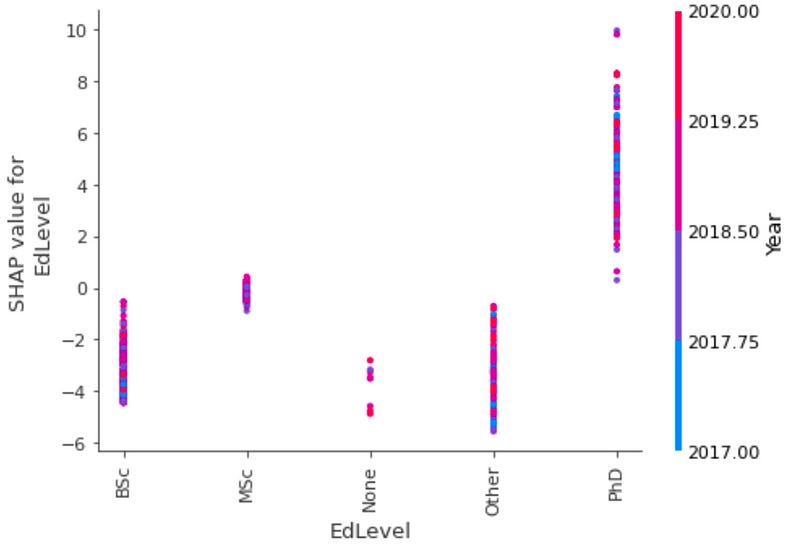
And again, the PhD / doctoral degree has the highest SHAP value among the educational levels, followed by an MSc degree:
Difference between SHAP values for PhD and MSc degrees per country, together with 1 sigma standard deviations:
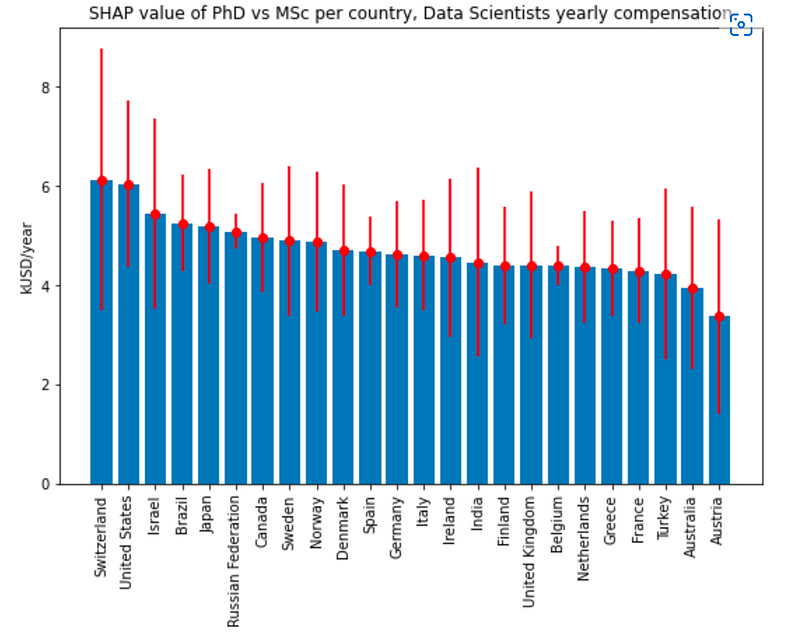
As we see, the highest value (in yearly compensation terms) of a PhD degree is in Switzerland, the United States, followed by Israel, Brazil and Japan. Remarkably, in countries like India, Brazil and Turkey, the SHAP value of a PhD degree is relatively high, despite smaller yearly compensation for Data Scientist roles in general.
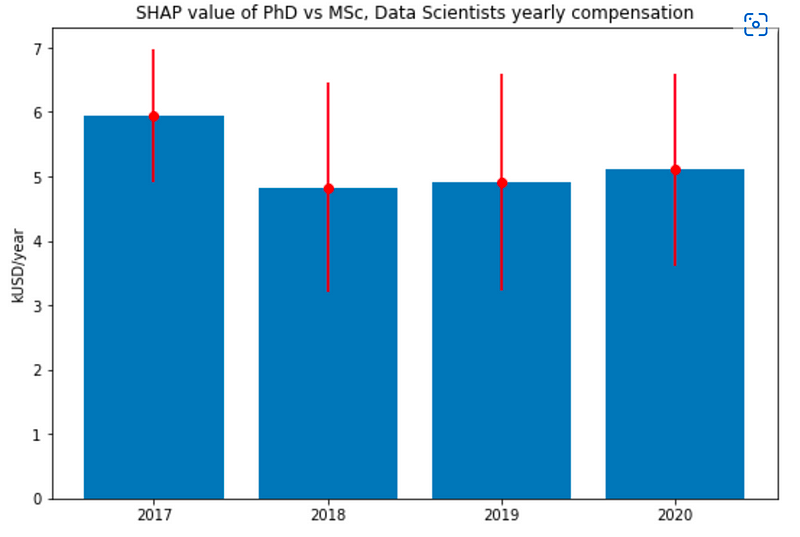
Also, as we see, there is a little change in the PhD vs MSc SHAP value over time:
I hope these results can be useful for you. In case of questions/comments, do not hesitate to write in the comments below or reach me directly through LinkedIn or Twitter.
You can also subscribe to my new articles, or become a referred Medium member.